

The story of Bjerkness Creek
Every creek has a story to tell. Water monitoring data helps tell that story. For almost a decade, the Kootenay Watershed Science program has monitored Bjerkness Creek near Kaslo, B.C. This is the story of Bjerkness Creek.
Within the 2,700-hectare mountainous Bjerkness watershed, there are over 100 water licences allowing people to divert, use or store the water from the creek. Most of the residents in the region surrounding Bjerkness Creek rely on its flows for all of their water needs. While the ebbs and flows of this creek are fairly typical, climate change is continuing to impact this watershed.
Bjerkness Creek tends to reach peak flow levels in early to mid-June. Flow levels then slowly drop off moving into summer and fall. The lowest flows occur in the late fall and winter months. Thanks to long-term data collection, Bjerkness Creek’s story can be told through a hydrograph — a graphical depiction of the amount of flow in the creek over time. The graph shown below is the complete record of flow at the Bjerkness Creek monitoring station since 2013.
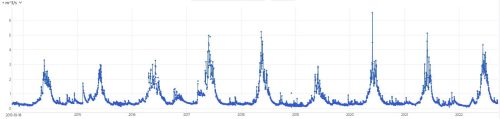
The hydrograph shows the complete record of flow at the Bjerkness Creek monitoring station since 2013.
The Bjerkness Creek dataset is now long enough that it captures the wide range of flows that can occur in this creek. This makes it an incredibly valuable tool in building our understanding of the watershed. By applying watershed modelling and climate change predictions to this dataset, we can even estimate what changes the future may bring in terms of the amount of water available and the timing of flows.
Preliminary modelling using data from the Water Survey of Canada shows significantly decreasing streamflow through the summer and fall over the coming decades as climate change warms our region. This type of information can support informed decision making for water management, development and infrastructure planning, and ecosystem health. It is also essential when considering the effects of climate change in our watersheds and supporting climate adaptation strategies for a safe and sustainable future.
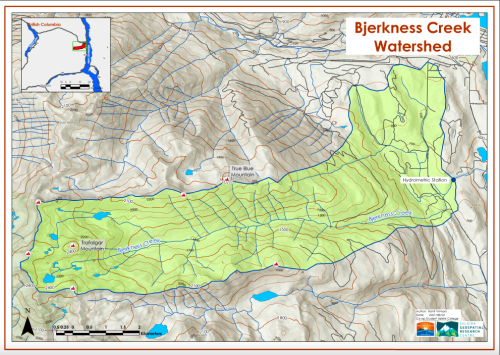
Map of the Bjerkness Creek Watershed created by the Selkirk Geospatial Research Centre at Selkirk College.
Over the past decade, the Kootenay Watershed Science project has been integral in establishing numerous hydrometric monitoring sites, including Bjerkness Creek, and collecting long-term data records of the region. This critical watershed data can be found on the Columbia Basin Water Hub and is feeding into the larger Living Lakes Canada program known as the Columbia Basin Water Monitoring Framework. This program is creating a unified and nested monitoring network to support the tracking and understanding of climate impacts on water supply for communities and ecosystems across the Columbia Basin.
In 2023, the Columbia Basin Water Monitoring Framework will expand hydrometric monitoring throughout the East and West Kootenays. A series of public meetings to collect community concerns and priorities around water is coming to a close. If you live in the Lower Columbia Kootenay region and have concerns about freshwater, please consider attending the final online community meeting on April 4th, 2-3:30 pm PT to help inform the selection of water monitoring sites.

